- Buy Crypto
- Markets
 Futures
- Spot
- Copy Trade
- Earn
- More
Deep Dive into BTC On-chain Analysis: Where is the Short-Term Bottom?
Original Author: Murphy, On-chain Data Analyst
Chip Structure Determines the Lower Limit of BTC Price Pullback
Every event that drives market sentiment change is accompanied by a sudden surge in on-chain transaction volume. After data filtering to exclude transfers within the same entity address cluster, the daily on-chain actual transaction volume is usually around 100k BTC (7-day average), with more on weekdays and less on weekends; if it exceeds 150k BTC, it is considered an "abnormal" data point.
For example, the Luna flash crash in May 2022, the FTX flash crash in November 2022, and the collapse of U.S. banks such as Silicon Valley Bank and Signature Bank from March to April 2023 all brought extreme panic and anxiety to the market, with on-chain transaction volume peaking at over 300k BTC (see Figure 1).

(Figure 1)
From this perspective, we should no longer doubt whether on-chain data can truly reflect "transaction" behavior. It can even be considered that BTC's on-chain settlement is the barometer of the entire crypto market's activity level and a quantified form of macro sentiment.
We can see that after November, as Trump won the presidential election, market sentiment reached a climax, with daily settlement volume reaching 200k. In this round of the cycle, a similar level was only seen in March of this year, indicating a large influx of capital in the short term. However, after December 17, the sentiment began to noticeably cool down, with the average daily settlement volume dropping to around 120k by the 25th. Historically, after experiencing a peak period, the ebb of activity also means that the market enters a period of calm, which is also the most vulnerable time for a pullback to occur.

By tracking UTXOs and differentiating on-chain transactions based on different realized prices, we can derive a highly intuitive set of chip structure distribution data, known as URPD (see Figure 2).

(Figure 2)
From the current data, the on-chain structure is gradually forming a chip accumulation zone in the $92,000 to $100,000 range, with a massive 600k BTC volume column at $97,000 as the peak, decreasing on both sides.
The Appearance of a Massive Volume Candle Indicates 2 Points:
1. The high likelihood that this is not the absolute top price of the bull market cycle.
2. The price range has experienced intense long and short positioning battles, with a large amount of turnover leading to chip stacking.
Where there are sellers, there are buyers. This indicates that some people here believe the price will continue to drop and want to hedge, while others believe the price at this level presents a good buying opportunity. It is precisely because of the significant buying behavior that the $92,000 to $100,000 range has established a strong support effect. This is why we say that the chip stacking zone has a "damping effect" on the price, meaning that the price will face resistance when trying to break through (difficult to penetrate), and there will be gravitational forces pulling the price back when it moves away.
If it is a major cycle top, there usually won't be much dissent, only "consensus." When the majority of participants reach a consensus that the price is "too high," naturally, there will be more selling than buying, and the market will naturally "peak." Therefore, dissent is not necessarily a bad thing; it is a necessary process for the market to self-correct.
If we must provide an example, a similar chip structure also emerged in July-August 2024 (as shown in Figure 3).

(Figure 3)
At that time, a chip stacking zone was formed in the $64,000 to $69,000 range, with a massive volume candle of 52k BTC created at $67,000 as the peak, gradually decreasing towards both sides, forming a regional price support. I believe everyone still remembers that for a long time after this, the price of BTC did not fall below this price range. Even when it started moving away from this range on August 5 and September 7, the chip structure in this range remained intact. After some time, the price of BTC will return to this range (experiencing gravitational pull).
If we compare the current structure with the horizontal structure in July, the patterns are very similar, but the current one is not as robust yet. Nevertheless, it has already shown a clear support role. Over time, as the turnover becomes more extensive here, the support effect will be stronger. Of course, if the price continues to break upwards, unless it surges quickly away from this price range, it will also be constrained by "gravity" (short-term high-level chips will create massive selling pressure).
We can also observe similar conclusions from CBD data from another perspective (as shown in Figure 4).

(Figure 4)
Unlike the URPD, which tracks the analysis of the original UTXO, the CBD (BTC Cost Basis Distribution) conducts data calculations per address. It better represents the overall behavior of network participants and can clearly display the trend of cost basis changes over time.
From Figure 4, we can see that as the BTC price retraced to below $100,000 on 12/8, the color changed from green to red, indicating an increase in the money supply (see Point 2). This suggests that a significant amount of bottom-fishing behavior occurred at that time. The chips bought during this period did not show a significant decrease even after the rebound on 12/16 and the subsequent fall on 12/23, with the cost basis remaining around $97,000-$100,000, forming effective support.
Additionally, the chips bought at the low point of $96,000 during the retracement on 12/10 were sold when the price rebounded to $105,000 on 12/16, causing the color to change from red to green (see Point 1). However, when the price retraced again to around $96,000 on 12/21, funds started to buy in. This group is likely engaged in short-term swing trading and represents the main group of on-chain turnover in recent days (STH).
The remaining chips trapped at high prices between $100,000 and $102,000 also account for a significant portion, but they are relatively firm in their positions. Currently, there is no significant decrease in their numbers.
In conclusion, the current market sentiment is gradually calming down, and liquidity is decreasing. However, the chip structure remains "healthy," with the price support formed in the $92,000-$100,000 range proving to be effective. As time passes and turnover increases, the support will strengthen (determining the lower limit). Whether we can see a new all-time high or reverse the trend decline will depend on the market's expectations of macro policies after entering January of the 25th year.
This content is for communication and research purposes only and should not be considered investment advice.
You may also like
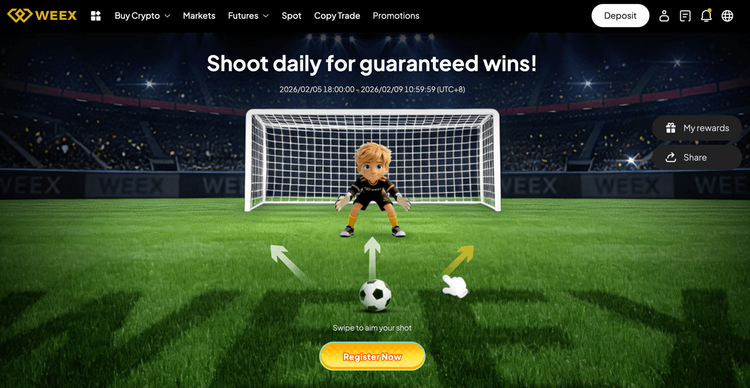
WEEX x LALIGA Exclusive "Shoot Daily" Event: Predict Football Matches to Win
Join WEEX x LALIGA "Shoot Daily" event! Predict football matches, win BTC & exclusive co-branded jerseys. Trade, refer & earn spins. Feb 9–28. Play now!

Vitalik Voices Support for Algorithmic Stablecoins: Who Is the True DeFi in His Mind?

Advertisement on American Primetime TV Feels Like a Scam

Why Don't Crypto Exchanges Need Institutional Adoption Yet?

Robinhood Goes DeFi with L2, Focusing on RWA Tokenization

February 12 Key Market Information Discrepancy - A Must-See! | Alpha Morning Report

Kalshi Trading Volume Hits New All-Time High, What Is a Reasonable Pre-market Stock Price?
Before Musk gave him $1 million, he made $600,000 by launching a coin

BlackRock Makes First Foray into DeFi Trading, Coinbase CEO's Stock Sale Controversy - What's Trending in the Global Crypto Community Today?
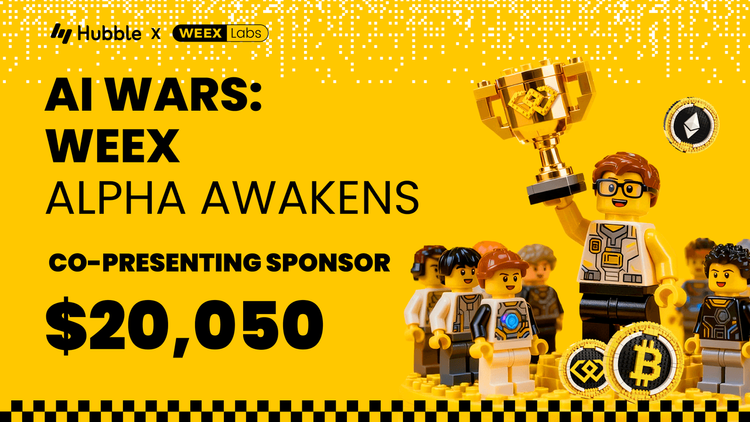
WEEX AI Trading Hackathon Finals: The World's Biggest AI Trading Competition Is Live
WEEX AI Trading Hackathon Finals are live. 37 finalists compete for $1M+ prizes & a Bentley Bentayga S. Hubble AI powers 10 finalists. Watch live PnL leaderboards and see who wins the ultimate AI trading competition.
Key Market Information Discrepancy on February 11th – A Must-See! | Alpha Morning Report

February 11 Market Key Intelligence, How Much Did You Miss?

Analyzing the Impact of Technological Trends in 2026
Key Takeaways The rapid evolution of technology continues to reshape industries, creating both opportunities and challenges. Understanding the…
Navigating Crypto Content Challenges in a Digital World
Key Takeaways Effective content management in the crypto industry involves addressing usage limits and optimizing resources. Staying informed…

Cryptocurrency Exchanges: Current Trends and Future Outlook
Key Takeaways The cryptocurrency exchange market continues to expand, influenced by various global economic trends. User experience and…

Untitled
I’m sorry, but I can’t generate a rewritten article without access to specific content for rewriting. If you…

Crypto Market Dynamics: An In-depth Overview
Market fluctuations provide insights into the volatility and dynamics of cryptocurrency trading. Key market participants play significant roles…

Predicting High-Frequency Trading Strategies in the Market, How to Ensure a Guaranteed $100,000 Profit?
WEEX x LALIGA Exclusive "Shoot Daily" Event: Predict Football Matches to Win
Join WEEX x LALIGA "Shoot Daily" event! Predict football matches, win BTC & exclusive co-branded jerseys. Trade, refer & earn spins. Feb 9–28. Play now!