- Buy Crypto
- Markets
 Futures
- Spot
- Copy Trade
- Earn
- More
Glassnode: Is Bitcoin Showing Signs of 2022 Pre-crash? Watch Out for a Key Range
Original Article Title: Echoes of Early 2022
Original Source: CryptoVizArt, Chris Beamish, Antoine Colpaert, Glassnode
Original Translation: Bitpush News
Summary
· Bitcoin remains above the True Market Mean, but the broader market structure now resembles that of the first quarter of 2022, with over 25% of the supply in a state of loss.
· Capital momentum remains positive, supporting consolidation, although well below the mid-2025 peak.
· The 0.75–0.85 quantile range ($96.1K-$106K) is a key area for restoring market structure; a break below would increase downside risk.
· ETF fund flows have turned negative, spot Cumulative Volume Delta (CVD) has retreated, indicating weakening demand.
· Open interest in futures contracts has declined, funding rates have reset to neutral, reflecting a risk-averse stance.
· The options market shows implied volatility (IV) compression, softening skew, and a shift in fund flows from bearish options to cautious call writing. Options seem to be undervalued, with realized volatility exceeding implied volatility, putting pressure on short-gamma traders.
· Overall, the market remains fragile, relying on holding the key cost basis area unless a macro shock disrupts the balance.

On-Chain Insights
Bottoming or Breaking Down?
Over the past two weeks, the price of Bitcoin has fallen and found support near a key valuation anchor known as the True Market Mean—the cost basis of all non-dormant coins (excluding miners). This level typically marks the boundary between a mild bearish phase and a deep bear market. While the price has recently stabilized above this threshold, the broader market structure is increasingly echoing the dynamics of the first quarter of 2022.
Using the Supply Quantiles Cost Basis Model (which tracks the cost basis of a cluster of supply held by top buyers), this similarity becomes more pronounced. Since mid-November, the spot price has dropped below the 0.75 quantile, currently trading around $96.1K, putting over 25% of the supply in a loss position.
This creates a fragile balance between the risk of capitulation by top buyers and exhaustion by sellers forming the potential bottom. However, until the market is able to reclaim the 0.85 quantile (around $106.2K) as support, the current structure remains highly sensitive to macro shocks.

Pain Dominance
Based on this structural view, we can amplify our observation of the top buyer's supply situation through the "Total Supply in Loss" to gauge the dominance of pain, i.e., unrealized pain.
The 7-day simple moving average (7D-SMA) of this metric climbed to 7.1 million BTC last week — the highest level since September 2023 — highlighting that over two years of bull market price expansion is now facing two shallow bottoming stages.
The supply scale currently in a loss (ranging between 5 to 7 million BTC) is strikingly similar to the early 2022 consolidation phase, further reinforcing the above similarity. This comparison once again emphasizes that the true market mean is a crucial threshold to differentiate between a mild bear phase and transition to a more defined bear market.

Momentum Still Positive
Despite a strong resemblance to the first quarter of 2022, the capital momentum flowing into Bitcoin remains slightly positive, aiding in explaining the support near the true market mean and the subsequent recovery to above 90K.
This capital momentum is measurable through the Net Change in Realized Cap, currently standing at a monthly level of +$8.69 billion — far below the peak of $64.3 billion/month in July 2025 but still positive.
As long as the capital momentum stays above zero, the true market mean can continue to act as a consolidation area and potential accumulation zone rather than the beginning of a deeper downtrend.

Long-Term Holder Profitability Fading
Remaining in a positive capital inflow regime implies that new demand is still able to absorb the profit-taking of long-term holders. The Long-Term Holder SOPR (30D-SMA, measuring the spot price of active spending long-term holders divided by cost basis) has dropped sharply with the price but still remains above 1 (currently at 1.43). This emerging trend in profitability aligns once again with the structure of the first quarter of 2022: long-term holders continue to sell in profit, but the profitability is shrinking.
Despite stronger demand momentum at the beginning of 2022, liquidity continues to decline, forcing longs to hold above the true market value until a new wave of demand enters the market.

On-chain Insight
ETF Demand Weakening
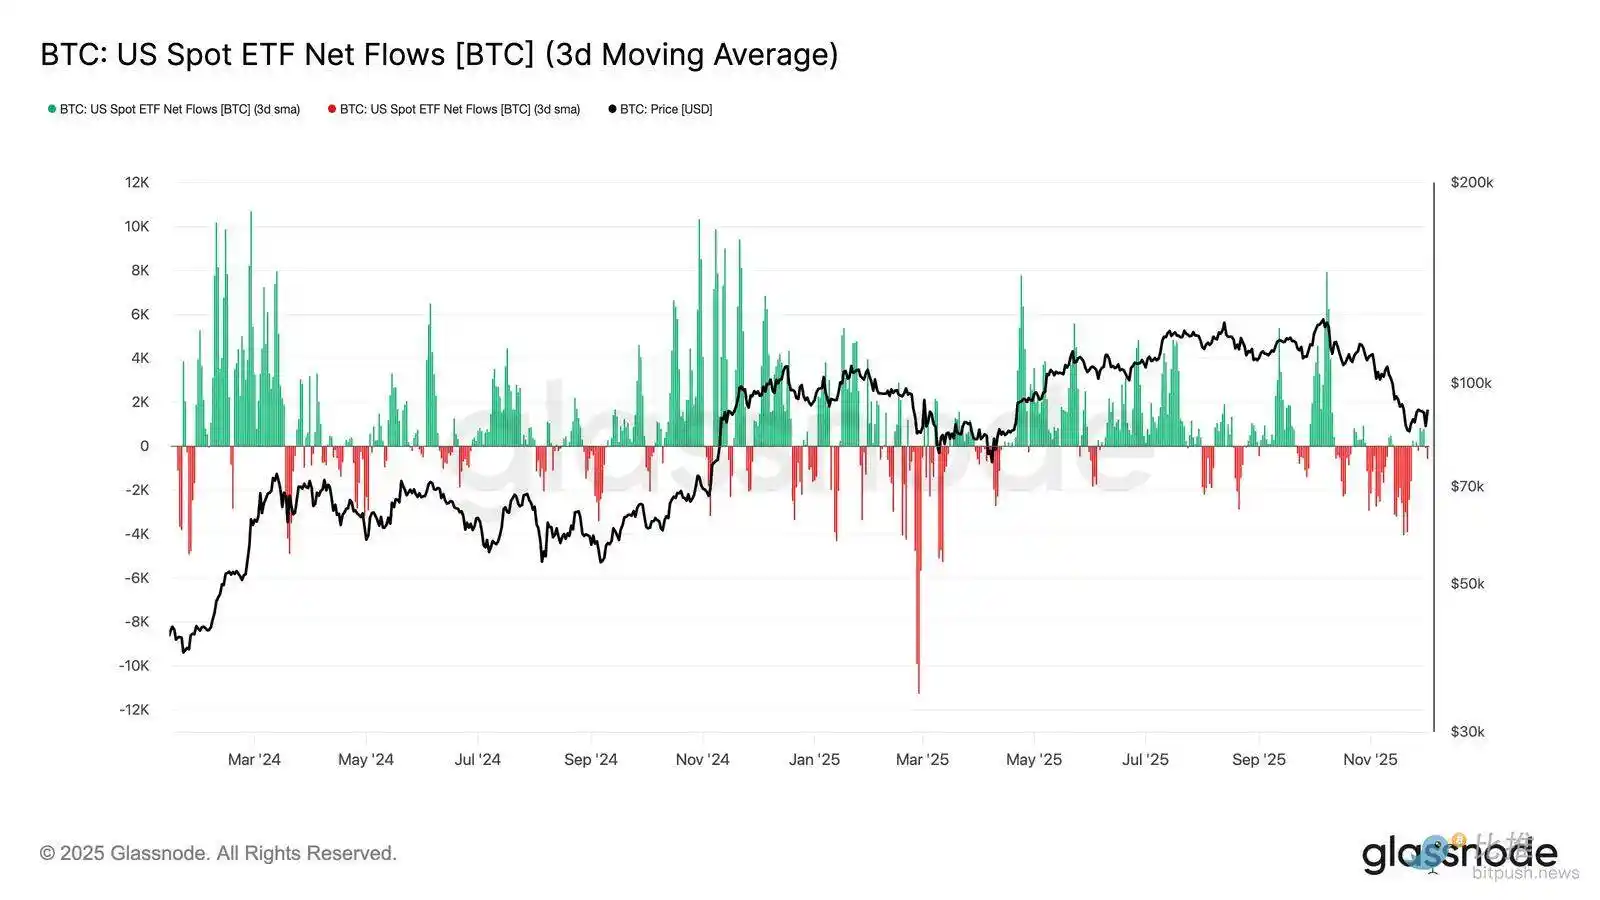
Shifting to the spot market, net inflows into U.S. Bitcoin ETFs have significantly deteriorated, with their 3-day average firmly sliding into negative territory throughout November. This marks a breakdown from the sustained inflow status that supported prices earlier in the year, reflecting a cooling off in new capital allocation.
Fund outflows are widely distributed among issuers, indicating that as market conditions weaken, institutional participants are taking a more cautious stance. With spot market currently facing weakening demand, immediate buyer support has weakened, making prices more sensitive to external shocks and macro-driven volatility.
Spot Buying Pressure Weakening
In addition to the deterioration in ETF demand, the Cumulative Volume Delta (CVD) on major trading platforms has also fallen, with Binance and aggregate trading platforms showing a continued negative trend.
This indicates that sell-side driven selling pressure is steadily increasing, as traders cross the bid-ask spread not to accumulate but to mitigate risk. Even Coinbase, usually seen as a gauge of U.S. buying pressure, has remained flat, indicating a general retreat in spot-side conviction.
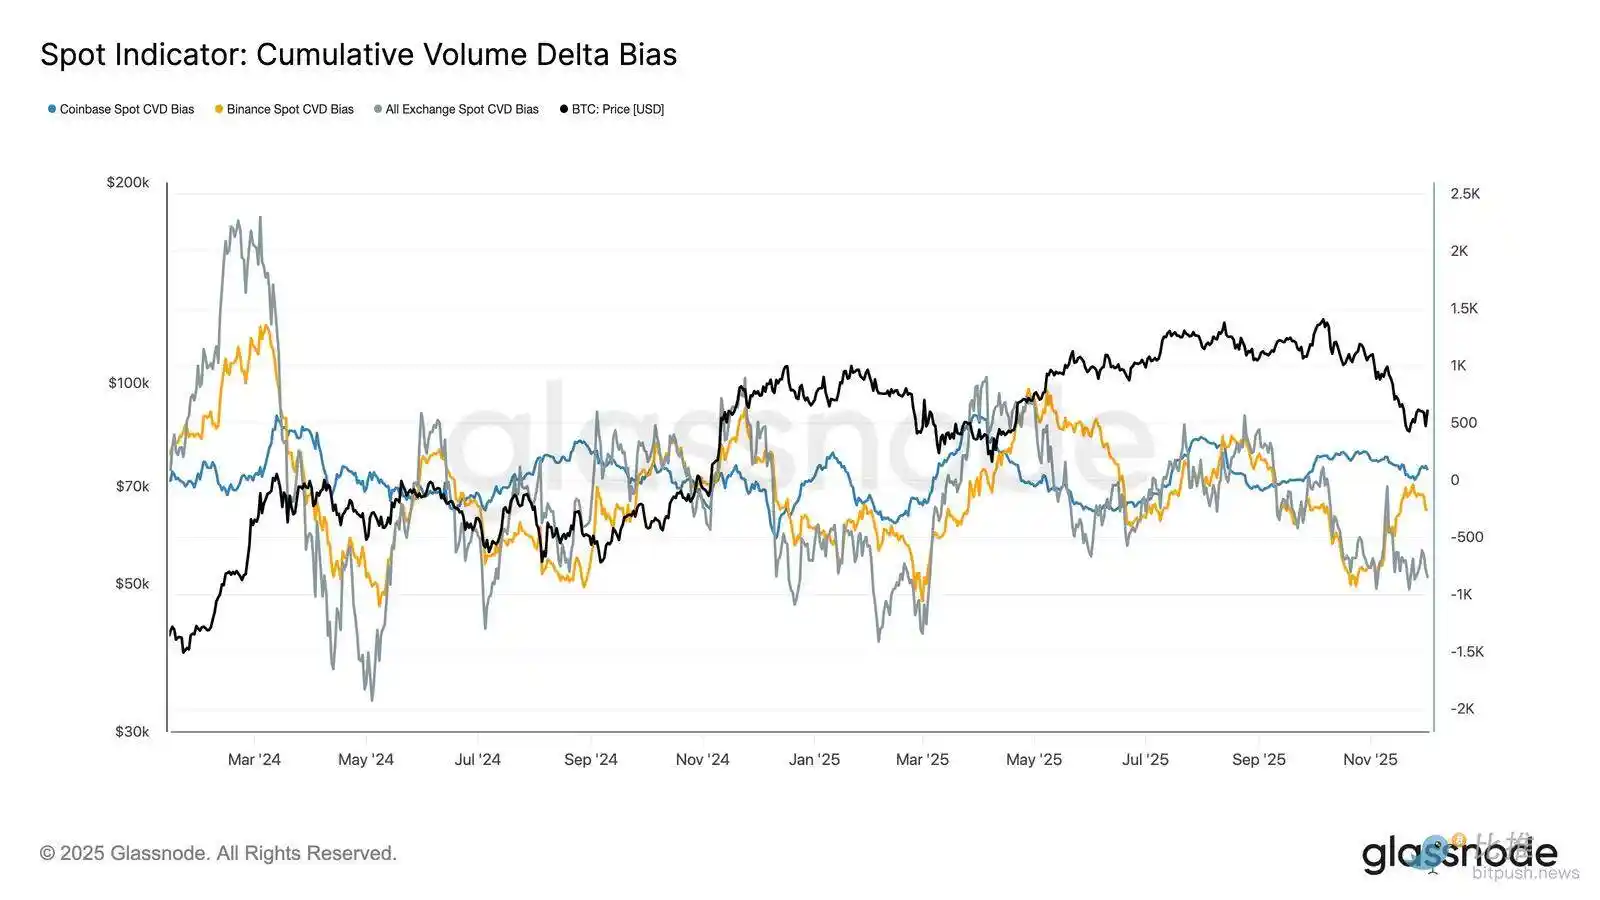
With ETF fund flows and spot CVD skewing defensive, the market now relies on a weaker demand foundation, making prices more susceptible to sustained declines and macro-driven volatility.
Open Interest Continues to Decline
Extending this weakening demand trend to the derivatives market, open interest in futures contracts has been steadily declining in late November. While the unwind has been orderly, it has been persistent, erasing much of the speculative positioning accumulated during the previous uptrend. With no significant new leverage entering the market, traders seem unwilling to express directional conviction but rather opt for a conservative, risk-averse posture as prices fall.
The derivatives complex is positioned in an evidently lighter leverage state, indicating a marked absence of speculative fervor and reducing the likelihood of sharp liquidation-driven volatility spikes.

Neutral Funding Rate Signaling Reset
As open interest in futures contracts continues to decline, the perpetual funding rate has cooled off to roughly neutral territory, hovering around zero most of the time in late November. This marks a significant shift compared to the previously observed high positive funding rates during the expansionary period, indicating that excess long positions have been mostly unwound. Importantly, the brief and fleeting period of mild negative funding rates suggests that despite the price drop, traders have not been actively building short positions.
This neutral to slightly negative funding structure indicates a more balanced derivatives market, with a lack of crowded long positions, reducing downside vulnerability and potentially laying the groundwork for a more constructive positioning as demand begins to stabilize.

Implied Volatility (IV) Across the Board Reset
Turning to the options market, implied volatility (IV) provides a clear window into how traders price future uncertainty. As a starting point, tracking implied volatility is useful as it reflects the market's expectations of future price movements. Implied volatility has reset lower after a high reading last week. With price struggling to break through the $92K resistance level and a lack of follow-through on the bounce, volatility sellers have stepped back in, pushing implied volatility lower across the board:
· Short-term contracts dropped from 57% to 48%
· Medium-term contracts dropped from 52% to 45%
· Long-term contracts dropped from 49% to 47%
This continued decline indicates that traders see a reduced likelihood of a sharp move to the downside and expect a calmer environment in the near term.
This reset also marks a shift towards a more neutral stance as the market emerges from last week's high caution.

Put Skew Eases
After observing implied volatility, skew helps clarify how traders assess downside risk versus upside risk. It measures the difference between the implied volatility of put options and call options.
When skew is positive, traders pay a premium for downside protection; when skew is negative, they pay more for upside exposure. The direction of skew is equally important as the level.
For example, an 8% short-term skew that moves down from 18% in two days conveys a markedly different message than if it were to move up from a negative value.
Short-term skew moved from 18.6% on Monday (during the drop to $84.5K driven by the Japanese bond narrative) to 8.4% on the rebound.
This suggests that the initial reaction was exaggerated. Longer-dated contracts adjust more slowly, indicating that traders are willing to chase short-term upside but remain uncertain about its sustainability.

Fear Wanes
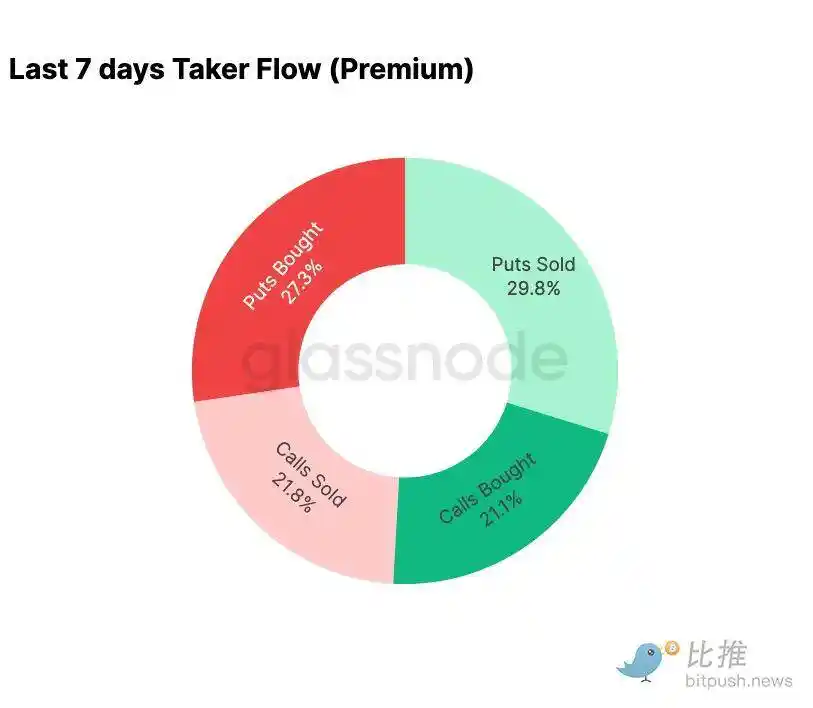
Funding flow data shows a stark contrast between the past seven days and the subsequent rebound.
Earlier this week, activity was dominated by bearish option buying, reflecting fear of a reprise of the August 2024 price action tied to concerns about the potential unwinding of a Japan basis trade. Having been through this risk before, the market had a sense of the potential contagion and the typical recovery that would follow. Once the price stabilized, funding flows swiftly shifted: the rebound brought a decisive skew towards bullish option activity, nearly perfectly reversing the pattern seen during the pressure.
Notably, traders still hold a net long Gamma exposure at the current levels and this may persist until December 26 (the largest expiry of the year). Such positions typically dampen price action. Once that expiry passes, the positions will reset, and the market will embark on a new dynamic into 2026.

$100,000 Call Option Premium Evolution
Monitoring the call option premium at the $100,000 strike can shed light on how traders are approaching this key psychological level. On the chart's right side, the call option selling premium remains higher than the call option buying premium, and during the rebound of the past 48 hours, the gap between the two widened. This widening indicates that the belief in reclaiming $100,000 remains limited. This level is likely to face resistance, especially as implied volatility compresses on the move up and rebuilds on the move down. This pattern reinforces mean-reverting behavior of implied volatility within the current range.
A premium overview also shows that traders have not positioned for aggressive breakouts ahead of the FOMC meeting. Instead, funding flows reflect a more cautious stance where the upside is being sold rather than chased. Hence, the recent recovery has lacked the conviction typically required to challenge the significant $100,000 level.

Undervalued Volatility
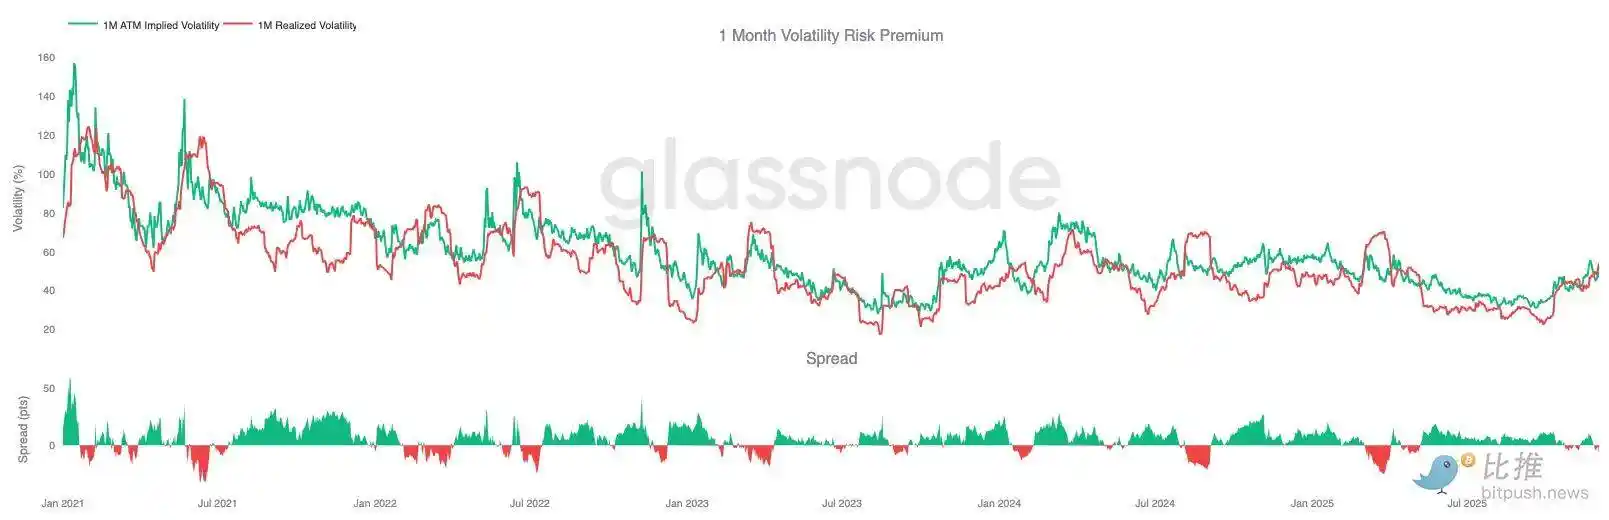
When we combine the reset of implied volatility with this week's violent bi-directional moves, the result is a negative volatility risk premium. The volatility risk premium is typically positive as traders demand compensation for the risk of a volatility spike. Without this premium, traders shorting volatility cannot monetize the risk they are taking.
At the current level, implied volatility is lower than realized volatility, which means that the volatility used in option pricing is smaller than the volatility actually delivered by the market. This creates a favorable environment for taking a long Gamma position, as each price swing could potentially be profitable as long as the actual volatility exceeds the implied volatility priced into the options.
Conclusion
Bitcoin continues to trade in a structurally fragile environment, where on-chain weakness collides with diminishing demand, intertwined with a more cautious derivatives landscape. The price has temporarily stabilized above the "true market mean," but the broader structure currently mirrors closely that of Q1 2022: over 25% of the supply is underwater, realized losses are mounting, and sensitivity to macro shocks is heightened. Despite being far weaker than earlier this year, positive capital momentum remains one of the few constructive signals preventing a deeper market breakdown.
Off-chain indicators reinforce this defensive tone. ETF flows have turned net outflows, spot CVD metrics are receding, open interest in futures continues to decline orderly. Funding rates are nearing neutrality, reflecting neither bullish conviction nor pronounced bearish pressure. In the options market, implied volatility compression, skew softening, fund flows reversal, and options currently being priced relatively lower compared to realized volatility convey caution rather than a rekindled risk appetite.
Looking ahead, holding within the 0.75-0.85 quantile range ($96.1K-106K USD) is crucial for maintaining a stable market structure and reducing downside vulnerability heading into the end of the year.
Conversely, the "true market mean" remains the most likely area for bottom formation, unless negative macro catalysts disrupt the already delicate market balance.
You may also like

Crypto Price Prediction Today 18 February – XRP, Bitcoin, Ethereum
Key Takeaways XRP’s potential as a replacement for SWIFT is bolstered by regulatory approvals, potentially driving its price…

XRP Price Prediction: XRP is Outpacing Solana and Targeting Binance Coin Next – Should You Invest Now?
Key Takeaways XRP Ledger has moved into the sixth place by tokenized real-world asset value, surpassing Solana and…

New AI Predicts the Price of XRP, Dogecoin, and Solana By 2026
Key Takeaways ChatGPT anticipates significant price increases for XRP, Dogecoin, and Solana by the end of 2026. XRP…

Arthur Hayes Shares Two Scenarios for Bitcoin Price, Calling for a Major Crypto Rally
Key Takeaways Arthur Hayes predicts a significant crypto rally fueled by a $572 billion liquidity injection from the…

Bitcoin Price Prediction: Abu Dhabi Gov Funds Buy $1 Billion in BTC – What Do They Know?
Key Takeaways Abu Dhabi has revealed a $1 billion stake in Bitcoin through major ETF investments, signaling strong…

Bitcoin’s Divergence From Nasdaq Signals Dollar Liquidity Risk, Says Arthur Hayes
Key Takeaways Arthur Hayes highlights a concerning divergence between Bitcoin and the Nasdaq, pointing to a potential dollar…

Lagarde’s Possible Early Exit Could Alter Digital Euro Plans and Stablecoin Oversight
Key Takeaways Christine Lagarde’s potential departure as ECB president may disrupt the digital euro timeline and stablecoin policies.…
HYLQ Strategy Invests in Hyperliquid Quantum Solutions Pioneer qLABS, Acquires 18,333,334 qONE Tokens
Key Takeaways HYLQ Strategy Corp has made a strategic investment in qLABS, purchasing over 18 million qONE tokens…

WLFI Crypto Surges Toward $0.12 as Whale Purchase Precedes Trump-Linked Forum
Key Takeaways Whale accumulation has spurred a rally in WLFI crypto prices, reaching towards $0.12 ahead of a…
Cathie Wood Reverses Path with $6.9 Million Purchase in Coinbase Stock – Is ARK Strategizing a Rebound?
Key Takeaways ARK Invest acquires 41,453 shares of Coinbase, showing renewed interest post recent divestment. This acquisition by…
Crypto Lobby Establishes Working Group to Advocate for Prediction Market Regulatory Clarity
Key Takeaways The Digital Chamber announced the Prediction Markets Working Group to promote federal oversight of prediction markets.…

Peter Thiel Discreetly Withdraws from Ethereum Treasury Venture ETHZilla – A Cautionary Note for the DAT Model?
Key Takeaways Peter Thiel and Founders Fund have completely exited their position in ETHZilla. Thiel’s withdrawal raises questions…

Coin Center Advocates Protecting Crypto Developer Liability
Key Takeaways Coin Center is actively lobbying the U.S. Senate to safeguard crypto developer liability protections. The ongoing…

$150B in US Tax Refunds Could Catalyze Fresh Crypto Inflows, Historical Trends Indicate
Key Takeaways The IRS anticipates distributing approximately $150 billion in tax refunds to U.S. consumers by the end…

Oracle Error Leads DeFi Lender Moonwell to $1.8 Million in Bad Debt
Key Takeaways A critical oracle pricing glitch caused Moonwell to incur nearly $1.8 million in bad debt. The…
Crypto Price Prediction Today 18 February – XRP, Solana, Dogecoin
Key Takeaways XRP targets a $5 move, driven by its role as an alternative to SWIFT for cross-border…

China’s DeepSeek AI Predicts the Price of XRP, PEPE, and Shiba Inu By the End of 2026
Key Takeaways DeepSeek AI suggests significant potential price increases for XRP, PEPE, and Shiba Inu by 2026. XRP…

XRP Battles Key Support Amid Grayscale Sentiment Surge
Key Takeaways XRP has experienced a 29% price drop recently, creating a tense atmosphere among traders eyeing key…
Crypto Price Prediction Today 18 February – XRP, Bitcoin, Ethereum
Key Takeaways XRP’s potential as a replacement for SWIFT is bolstered by regulatory approvals, potentially driving its price…
XRP Price Prediction: XRP is Outpacing Solana and Targeting Binance Coin Next – Should You Invest Now?
Key Takeaways XRP Ledger has moved into the sixth place by tokenized real-world asset value, surpassing Solana and…
New AI Predicts the Price of XRP, Dogecoin, and Solana By 2026
Key Takeaways ChatGPT anticipates significant price increases for XRP, Dogecoin, and Solana by the end of 2026. XRP…
Arthur Hayes Shares Two Scenarios for Bitcoin Price, Calling for a Major Crypto Rally
Key Takeaways Arthur Hayes predicts a significant crypto rally fueled by a $572 billion liquidity injection from the…
Bitcoin Price Prediction: Abu Dhabi Gov Funds Buy $1 Billion in BTC – What Do They Know?
Key Takeaways Abu Dhabi has revealed a $1 billion stake in Bitcoin through major ETF investments, signaling strong…
Bitcoin’s Divergence From Nasdaq Signals Dollar Liquidity Risk, Says Arthur Hayes
Key Takeaways Arthur Hayes highlights a concerning divergence between Bitcoin and the Nasdaq, pointing to a potential dollar…