- Buy Crypto
- Markets
 Futures
- Spot
- Copy Trade
- Earn
- More
On-Chain Data School (Part Four): Visualizing BTC UTXO Age Price Distribution Chart
Original Article Title: "On-chain Data Classroom (Part 4): Visualizing the $BTC Chip Price Distribution Chart "
Original Article Author: Mr. Berg, On-chain Data Analyst
This article is the 4th in the On-chain Data Classroom series, which consists of 10 articles in total. Take you step by step to understand on-chain data analysis. Interested readers are welcome to follow this series of articles.
Related Reading: "On-chain Data Classroom (Part 3): Have the Bottom Fishing Whales Taken Profit?"
TLDR
- This article will introduce the on-chain metric URPD
- URPD shows the distribution of $BTC chips at different holding costs
- URPD can be used to observe chip turnover, distribution conditions, and provide guidance on trends
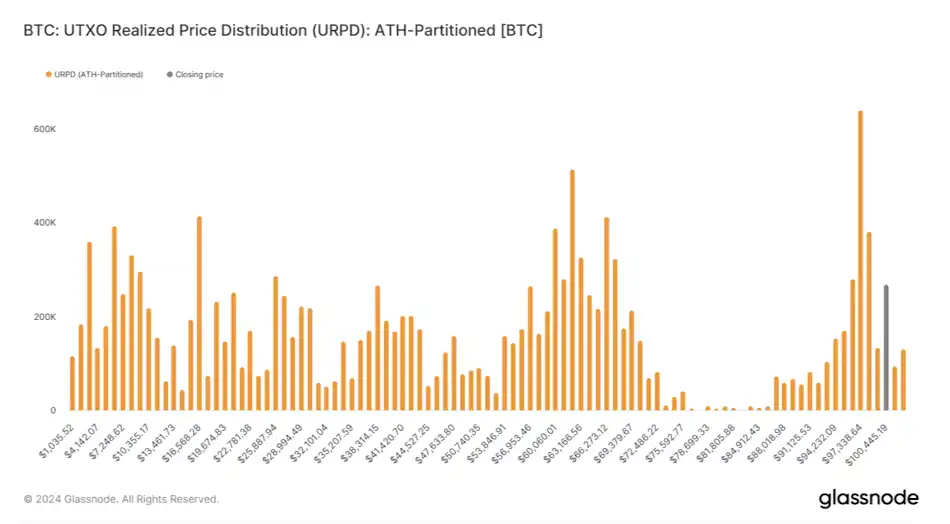
What is URPD?
URPD, short for UTXO Realized Price Distribution.
Due to BTC's unique UTXO blockchain structure,
we can track data on-chain that is unavailable in traditional financial markets.
The URPD chart is an indicator derived from this principle,
where we can see the number of chips corresponding to each price level on the chart,
equivalent to showing the "buying cost of each $BTC."
URPD, Chip Turnover, Accumulation, and Distribution
After understanding the concept of URPD,
we can then observe the turnover of chips at different price levels based on the daily URPD changes.
For example:
Chart one below is the URPD chart for May 1,
while chart two is the URPD chart for October 1.
After experiencing five months of wide-ranging fluctuations in price,
It is quite obvious to see the phenomenon of low-cost chips being distributed upwards.

URPD, Chip Turnover, Accumulation, and Distribution (2)
In history, at a market top, it is usually accompanied by the tail end of high-profit low-cost chip distribution;
while at a market bottom, a large amount of chips can be seen accumulating in a relatively narrow range.
Therefore, in analysis,
URPD is often observed together with other data (such as realized profit, MVRV, etc.),
integrating logical thinking to understand the market from a more comprehensive perspective.

Support, Resistance, Consensus
When a significant amount of chips begins to accumulate in a single price range,
it indicates that a supply-demand consensus has gradually formed in that range.
Once the price later rapidly rises out of that range,
due to the high turnover of chips in that range,
it is likely to provide support in the future;
Conversely, if the price falls below that range,
the chips in that range will become trapped chips,
which may act as resistance levels in future price increases.
Conclusion
The above is all the content of On-Chain Data School (Part Four). For readers interested in delving deeper into on-chain data analysis, remember to keep track of this series of articles!
If you want to see more analysis and educational content on on-chain data, feel free to follow my Twitter handle (X)!
Hope this article has been helpful to you. Thank you for reading.
You may also like

Aave Founder: What Is the Secret of the DeFi Lending Market?

The Trader's Playbook: 7 Market Cycle Lessons From LALIGA’s 90 Minutes
What do LALIGA matches teach about crypto markets? Learn how consolidation, breakouts, and late-cycle volatility shape disciplined trading decisions.
How Smart Money Tracker Survived Live AI Trading at WEEX AI Hackathon
Discover how WEEX AI Trading Hackathon tested strategies with real capital—no simulations. See how Smart Money Tracker survived flash crashes and leveraged 18x in live markets.

80% Win Rate to 40% Drawdown: An AI Trader's Brutal Recalibration at WEEX AI Wars
Dive into the technical blueprint of an AI trading system built on LLaMA reasoning and multi-agent execution. See how Quantum Quaser uses confidence thresholds & volatility filters at WEEX AI Wars, and learn the key to unlocking 95% win rate trades.
AI Trading Strategy Explained: How a Beginner Tiana Reached the WEEX AI Trading Hackathon Finals
Can AI trading really outperform human emotion? In this exclusive WEEX Hackathon finalist interview, discover how behavioral signal strategies, SOL trend setups, and disciplined AI execution secured a spot in the finals.
When AI Takes Over the 'Shopping Journey,' How Much Time Does PayPal Have Left?

Bloomberg: Aid Turkey Freeze $1 Billion Assets, Tether Remakes Compliance Boundary

Polymarket vs. Kalshi: The Full Meme War Timeline

Consensus Check: What Consensus Was Born at the 2026 First Conference?

Resigned in Less Than a Year of Taking Office, Why Did Yet Another Key Figure at the Ethereum Foundation Depart?

Russian-Ukrainian War Prediction Market Analysis Report

Ethereum Foundation Executive Director Resigns, Coinbase Rating Downgrade: What's the Overseas Crypto Community Talking About Today?

Who's at the CFTC Table? A Rebalancing of American Fintech Discourse

AI Trading vs Human Crypto Traders: $10,000 Live Trading Battle Results in Munich, Germany (WEEX Hackathon 2026)
Discover how AI trading outperformed human traders in WEEX's live Munich showdown. Learn 3 key strategies from the battle and why AI is changing crypto trading.

Elon Musk's X Money vs. Crypto's Synthetic Dollars: Who Wins the Future of Money?
How do Synthetic Dollars work? This guide explains their strategies, benefits over traditional stablecoins like USDT, and risks every crypto trader must know.

The Israeli military is hunting a mole on Polymarket

Q4 $667M Net Loss: Coinbase Earnings Report Foreshadows Challenging 2026 for Crypto Industry?

BlackRock Buying UNI, What's the Catch?
Aave Founder: What Is the Secret of the DeFi Lending Market?
The Trader's Playbook: 7 Market Cycle Lessons From LALIGA’s 90 Minutes
What do LALIGA matches teach about crypto markets? Learn how consolidation, breakouts, and late-cycle volatility shape disciplined trading decisions.
How Smart Money Tracker Survived Live AI Trading at WEEX AI Hackathon
Discover how WEEX AI Trading Hackathon tested strategies with real capital—no simulations. See how Smart Money Tracker survived flash crashes and leveraged 18x in live markets.
80% Win Rate to 40% Drawdown: An AI Trader's Brutal Recalibration at WEEX AI Wars
Dive into the technical blueprint of an AI trading system built on LLaMA reasoning and multi-agent execution. See how Quantum Quaser uses confidence thresholds & volatility filters at WEEX AI Wars, and learn the key to unlocking 95% win rate trades.
AI Trading Strategy Explained: How a Beginner Tiana Reached the WEEX AI Trading Hackathon Finals
Can AI trading really outperform human emotion? In this exclusive WEEX Hackathon finalist interview, discover how behavioral signal strategies, SOL trend setups, and disciplined AI execution secured a spot in the finals.